
Excel is a powerful tool that has become an indispensable part of our professional and personal lives. In this comprehensive article, we will delve into the world of Excel, exploring its main features, uses, and providing practical tips and tricks for making the most of this versatile software.
From understanding the basics of spreadsheets to harnessing the power of formulas and functions, we’ll cover it all. Whether you’re a novice or a seasoned Excel user, there’s something for everyone in this guide. So, let’s jump right in and unlock the full potential of Excel.
What is Excel?
Excel, developed by Microsoft, is a powerful spreadsheet software that serves as a versatile tool for data analysis, business intelligence, and overall productivity in the modern workplace. It is an integral part of Microsoft Office, offering a wide range of features and efficiency-enhancing capabilities.
One of the key reasons for Excel’s significance in data management is its ability to handle large datasets and perform complex calculations with ease, making it an indispensable asset for financial modeling, budgeting, and forecasting. Its usability extends across various industries, including finance, marketing, human resources, and operations, allowing professionals to organize and manipulate data efficiently.
Mastering Excel can significantly impact career growth by improving analytical skills, enhancing decision-making abilities, and streamlining processes, thereby boosting personal development and professional success.
What are the Main Features of Excel?
Excel encompasses a multitude of key features that empower users to perform intricate data analysis and manipulation, including advanced formulas, functions, pivot tables, charts, graphs, VLOOKUP, and conditional formatting.
Spreadsheets
Spreadsheets in Excel provide a structured framework for efficient data organization, utilizing workbooks to manage multiple sets of data and arranging information in cells, rows, and columns.
By allowing for the creation of formulas and functions, spreadsheets in Excel enable users to perform complex calculations and analysis, facilitating quick decision-making. They also offer a platform for visual representation of data through charts and graphs, enhancing data interpretation and presentation. The ability to filter, sort, and manipulate data within spreadsheets streamlines the process of extracting valuable insights. Spreadsheets in Excel play a vital role in optimizing data management and analysis, making them an indispensable tool for professionals across various industries.
Formulas and Functions
Excel’s advanced formulas and functions enable intricate data manipulation, automated calculations, and the utilization of macros to streamline repetitive tasks and enhance overall efficiency.
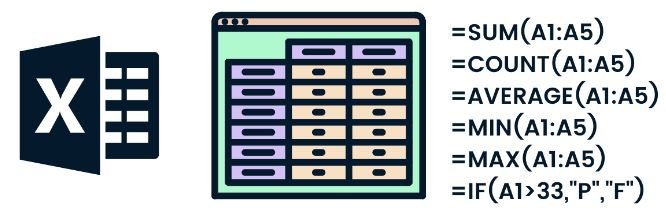
These powerful tools allow users to perform complex mathematical and logical operations, such as SUM, AVERAGE, VLOOKUP, and IF statements, with ease and accuracy. Excel offers an extensive library of pre-built functions for financial, statistical, and engineering calculations, catering to diverse analytical needs. By harnessing these capabilities, professionals can expedite decision-making processes and generate insightful reports, thereby boosting productivity and facilitating informed business strategies.
Charts and Graphs
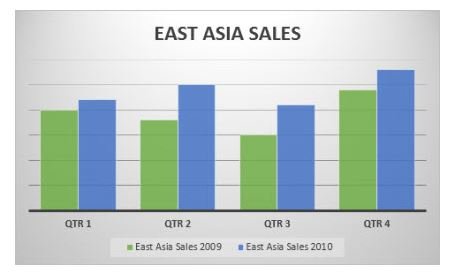
Excel facilitates data visualization through a diverse array of charts and graphs, allowing users to present information in visually compelling and informative formats to enhance data comprehension and analysis.
This capability of Excel is invaluable in enabling users to transform raw data into meaningful insights. By harnessing the power of various chart types like bar, line, scatter plots, and graphs such as pie charts and histograms, Excel empowers users to bring clarity to their data presentations. The interactive features of these visualizations not only aid in effective storytelling but also support in-depth analysis, making Excel an indispensable tool for professionals across various industries.
Data Analysis
Excel empowers users to conduct comprehensive data analysis through features such as pivot tables, advanced data sorting, filtering capabilities, and various mathematical operations, aiding in insightful decision-making processes.
These functionalities allow users to efficiently organize and analyze large datasets, enabling them to uncover trends, patterns, and correlations. Pivot tables offer a dynamic way to summarize, analyze, and present data, while the advanced data sorting and filtering capabilities make it easy to focus on specific information. Excel’s mathematical operations, including functions like SUM, AVERAGE, and VLOOKUP, facilitate various calculations and statistical analyses, providing valuable insights for informed business strategies.
What are the Uses of Excel?
Excel is a versatile tool that is extensively utilized in various fields such as finance, marketing, project management, and human resources.
Professionals in finance utilize Excel for tasks like financial modeling, budgeting, and data analysis.
In marketing, it helps in market research, campaign analysis, and customer data management.
Project managers rely on Excel for creating Gantt charts, tracking milestones, and resource allocation.
Human resources professionals use Excel for analyzing employee data, managing payroll, and creating HR reports.
Its application in data manipulation, database integration, reporting, and business analysis makes it an indispensable tool in numerous industries.
Financial Management
In financial management, Excel facilitates crucial calculations, streamlined reporting, and sophisticated analysis, aiding financial professionals in making informed decisions and maintaining data accuracy.
The diverse range of functions within Excel enables users to perform complex financial calculations with ease, from simple equations to intricate financial modeling. Its ability to create dynamic and interactive reports empowers professionals to present complex financial data in a clear and visually compelling manner.
Excel’s robust data analysis tools equip financial professionals with the means to identify trends, predict future outcomes, and derive invaluable insights, contributing significantly to strategic financial planning and decision-making processes.
Data Organization and Analysis
Data organization and analysis play a crucial role in the efficiency of any organization, and Excel serves as a powerful tool in this regard.
Its support for database integration, data import and export, validation, sorting, and filtering makes it an indispensable asset for professionals working with large volumes of data. Excel’s ability to seamlessly integrate with databases allows for real-time data updates, while its robust data import and export functionalities facilitate smooth data exchange across platforms. The validation features in Excel ensure data accuracy and consistency, while the sorting and filtering options enable users to efficiently analyze and extract insights from their datasets.
Project Management
Excel aids project management endeavors by facilitating effective data management, visualization through dashboards, and structured organization of project data within workbooks, fostering efficient project tracking and decision-making.
This powerful tool enables project managers to aggregate and analyze data from various sources, allowing for a comprehensive view of project progress. With Excel’s support for creating dynamic dashboards, stakeholders can swiftly grasp the project’s status and performance metrics, enhancing transparency and informed decision-making.
Excel’s ability to organize project data within workbooks promotes streamlined access and management, ensuring that pertinent information is readily available for effective collaboration and project execution.
Budgeting and Planning
Excel is instrumental in budgeting and planning processes, enabling intricate calculations, comprehensive reporting, and detailed analysis to support robust financial decision-making and strategic planning.
It allows users to create complex financial models, perform sensitivity analysis, and generate visually engaging reports, making it a versatile tool for financial professionals.
With its powerful data analysis features, Excel empowers users to extrapolate trends and patterns, facilitating informed strategic decisions.
Its integration with other Microsoft Office tools ensures seamless data transfer and sharing, streamlining collaborative efforts in budgeting and planning activities.
How to Use Excel?
Mastering Excel involves comprehensive tutorials, dedicated training, and leveraging various tips and tricks to maximize usability and harness its user-friendly interface for collaborative work and seamless sharing through cloud storage.
When diving into the world of Excel, it’s crucial to understand not only the basic functions but also the advanced features such as pivot tables, data visualization, and formula auditing. Through in-depth tutorials, users can grasp these complex concepts and apply them effectively in their work. Dedicated training programs provide hands-on experience and real-world scenarios, refining users’ proficiency. Usability tips, including keyboard shortcuts and data validation techniques, further enhance efficiency. Collaborative features like sharing workbooks and simultaneous editing streamline teamwork, making Excel an indispensable tool in various professional fields.
Creating a Spreadsheet
Creating a spreadsheet in Excel involves efficient data entry, effective formatting, and customization options to tailor the layout and appearance of the spreadsheet to specific user requirements and preferences.
Data entry can be done by inputting values, formulas, and functions into the cells. Formatting elements such as fonts, colors, and styles can be adjusted to enhance visual appeal, and customization options like adding headers, footers, and pivot tables permit the modification of the spreadsheet’s structure.
Entering Data
Entering data into Excel requires meticulous data management practices, validation procedures, and manipulation techniques to ensure the accuracy and reliability of the input information for subsequent analysis and utilization.
This involves organizing the data into appropriate columns and rows, implementing data validation rules to prevent errors, and utilizing functions and formulas for data manipulation. It is essential to review and clean the data regularly, removing duplicates and ensuring consistency.
Effective data entry also involves using shortcuts and efficient techniques to streamline the process and minimize errors. By incorporating best practices for data entry in Excel, businesses can enhance the quality and integrity of their data for informed decision-making and analysis.
Using Formulas and Functions
Leveraging Excel’s formulas and functions involves strategic data manipulation, automation of repetitive tasks, and precise calculations to derive meaningful insights and facilitate efficient decision-making processes.
These formulas and functions play a vital role in streamlining complex data sets, allowing users to perform a wide array of calculations, from simple arithmetic to complex statistical analysis. By organizing and interpreting data efficiently, Excel’s functions enable users to automate tasks such as sorting, filtering, and summarizing data.
These features empower users to harness the power of conditional formatting, lookup functions, and array formulas, thereby enhancing data analysis and manipulation capabilities.
Creating Charts and Graphs
Creating charts and graphs in Excel involves the effective visualization of data, utilizing various graphical formats to present information in a visually compelling and comprehensible manner, serving as valuable aids for data interpretation and analysis.
These visual representations enable users to identify trends, relationships, and patterns within the data, facilitating informed decision-making. Excel offers a wide array of chart types such as pie charts, bar graphs, and scatter plots, allowing users to choose the most suitable format for their data.
Charts and graphs play a pivotal role in summarizing large datasets, making complex information more accessible and understandable. Excel’s customization options enable users to adjust colors, labels, and styles, enhancing the visual appeal and clarity of the charts.
What Are Some Tips and Tricks for Using Excel?
Leveraging Excel efficiently involves adopting various tips and tricks to enhance usability, incorporating macros and templates, fostering collaborative work environments, and effectively troubleshooting issues through access to helpful resources.
By utilizing keyboard shortcuts, users can significantly boost their productivity. Creating custom macros and utilizing existing templates can streamline repetitive tasks and save time. Embracing collaborative features such as shared workbooks and real-time editing facilitates efficient teamwork. Staying updated with the latest troubleshooting techniques can resolve any technical hiccups and ensure a smooth Excel experience.
Keyboard Shortcuts
Utilizing keyboard shortcuts in Excel significantly boosts productivity and enhances efficiency, offering swift access to various commands and operations for seamless workflow optimization.
These shortcuts enable users to perform tasks such as data entry, formatting, and formula editing with minimal effort, streamlining the overall process. By reducing the reliance on manual mouse navigation, they empower users to navigate complex spreadsheets, analyze data, and make quick adjustments effortlessly. Incorporating these shortcuts into daily Excel usage not only saves time but also improves accuracy, thus allowing individuals to focus on data interpretation and analysis, ultimately contributing to more informed decision-making.
Using Templates
Leveraging templates in Excel streamlines work processes, saves time, and ensures consistency in data presentation and analysis, fostering efficient and standardized workflows.
When a user employs a well-designed template, it provides a structure for organizing data and creating professional-looking reports and presentations. By utilizing predefined formulas and formatting, individuals can avoid repetitive tasks and focus more on analyzing the data. This not only enhances productivity but also reduces errors.
The ability to customize templates to suit specific needs further adds to their value, enabling users to tailor the layout and design to their preferences. Ultimately, the use of templates in Excel plays a vital role in facilitating seamless and optimized workflow management.
Data Validation
Implementing data validation techniques in Excel ensures data accuracy, prevents errors, and safeguards data integrity, providing a reliable foundation for subsequent analysis and decision-making processes.
This process entails setting specific criteria and rules for data entry, which helps to minimize the occurrence of input errors and inconsistencies. By defining acceptable ranges, formats, and values for input cells, data validation effectively maintains the consistency and reliability of the information stored within the Excel spreadsheet. It facilitates the creation of error-free reports and simplifies the task of extracting meaningful insights from the data. Such accurate and credible data serves as the cornerstone for informed decision-making, contributing significantly to the success of various business endeavors.
Conditional Formatting
Conditional formatting in Excel facilitates the visual representation of data patterns and trends through the application of visual indicators, aiding in data analysis and interpretation for informed decision-making.
By using conditional formatting, users can easily identify specific data points, such as highlighting cells that meet specific criteria or emphasizing the highest and lowest values within a range. This feature plays a crucial role in visually emphasizing significant insights, making it easier to spot trends, outliers, and correlations within the dataset.
Conditional formatting allows for the customization of color scales and icon sets, enabling users to effectively convey the magnitude and relationships of the data, ultimately enhancing the overall experience of data analysis and interpretation.
Frequently Asked Questions
What is Microsoft Excel and how is it used?
Microsoft Excel is a powerful spreadsheet software used for organizing, storing, and analyzing data. It is commonly used in business, finance, and other industries to create charts, graphs, and tables.
How do I open and save an Excel file?
To open an Excel file, you can click on File and then Open, or you can double-click on the file from your file explorer. To save an Excel file, click on File and then Save or Save As. You can also use the shortcut Ctrl + S to quickly save your changes.
What are the different functions and formulas in Excel?
Excel has a wide range of built-in functions and formulas that can perform various calculations and operations on your data. Some common functions include SUM, AVERAGE, MAX, and MIN. Formulas, on the other hand, are user-defined equations that can be created using these functions and other mathematical operators.
How do I format my data in Excel?
Excel offers various formatting options to customize the appearance of your data. You can change font styles, add borders, apply colors, and adjust cell alignment. You can also use conditional formatting to highlight cells that meet certain criteria.
Can I use Excel for data analysis?
Absolutely! Excel has powerful data analysis tools such as PivotTables and PivotCharts that allow you to quickly summarize and visualize your data. You can also use the built-in sorting and filtering options to organize your data and make it easier to analyze.
How can I become proficient in using Excel?
The best way to become proficient in Excel is to practice and explore its features. You can also enroll in online courses or watch tutorials to learn new tips and tricks. Excel also has a Help feature that provides step-by-step instructions for various tasks.


Comments closed.